Sunday, 19 February 2017

Create LinkTable For Fact Tables of Different Grains

Create LinkTable For Fact Tables of Different Grains

If fact tables have different grains, we need to create a linktable to remove synthetic key and make data modeling to be star schema.
Step:
1.  Create composite key in each fact table that will associate the rows in the fact table to the linktable.
2.  Use concatenate or join to create linktable
3.  Drop the key fields that have been added to the linktable from the fact tables

Example:
Sales:
LOAD
AutoNumber(Floor(Date)&'-'& Store&'-'& Product,'Composite_Key1') As Composite_Key1,
[Store],
Product,
Quantity,
Date,
Time,
Amount
FROM
E:\Source\Sales.txt
(txt, codepage is 936, embedded labels, delimiter is ',', msq);
Budget:
LOAD AutoNumber(Floor(Date)&'-'& Store&'-'& Product,'Composite_Key1') As Composite_Key1,
[Store],
Product,
Date,
Budget
FROM
E:\Source\Budget.txt
(txt, codepage is 936, embedded labels, delimiter is ',', msq);
LinkTable:
Load Distinct Composite_Key1,Store,Date,Product Resident Sales;
Join(LinkTable)
Load Distinct Composite_Key1,Store,Date,Product Resident Sales;
Drop Fields Store,Date,Product From Sales,Budget;


This produced data model like the following:


Stock:
Load AutoNumber(Store&'-'&Product,'Composite_Key2') As Composite_Key2,
[Store],
Product,
In_Stock
FROM
E:\Source\Stock.txt
(txt, codepage is 936, embedded labels, delimiter is ',', msq);
Join(LinkTable)
Load Distinct Composite_Key2,Store,Product Resident Stock;
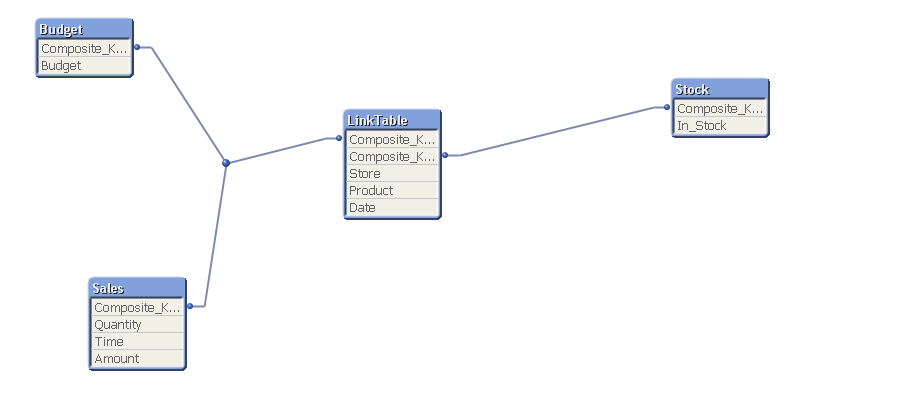
Drop Fields Store,Product From Stock;

the data model looks like the following:


Friday, 3 February 2017

Hierarchy Function In Qlikview


In Qlikview Hierarchy function consists of following parameters:
Hierarchy (NodeID, ParentID, NodeName, [ParentName], [PathSource], [PathName], [PathDelimiter], [Depth]) (loadstatement | selectstatement)
Here is a quick description of each of the parameters:
NodeID - is the name of the field that contains the node id.
ParentID - is the name of the field that contains the node id of the parent node.
NodeName - is the name of the field that contains the name of the node.
ParentName - is a string used to name the new ParentName field. If omitted, this field will not be created.
PathSource - is the name of the field that contains the name of the node used to build the node path. This is an optional parameter. If omitted, NodeName will be used.
PathName - is a string used to name the new Path field, which contains the path from the root to the node. This is an optional  parameter. If omitted, this field will not be created.
PathDelimiter - is a string used as delimiter in the new Path field. This is an optional parameter. If omitted, ‘/’ will be used.
Depth - is a string used to name the new Depth field, which contains the depth of the node in the hierarchy. This is an optional parameter. If omitted, this field will not be created.

Here is an example for Qlikview Hierarchy:
 // made an cooperation organization structure table.

 ORGANIZATION:
LOAD * INLINE [
    ROLE, REPORTINGMANAGER, LEVELOFBUSINESSHEAD
    Trainee, Investment Manager, Marketing Manager
    Junior Consultant, Sales Manager, Marketing Manager
    Consultant, Operation Manager, Marketing Manager
    Senior Consultant, Operation Manager, Marketing Manager
    Investment Manager, Marketing Manager, Domestic Headquarters
    Operations Manager, Marketing Manager, Domestic Headquarters
    Sales Manager, Marketing Manager, Domestic Headquarters
    Marketing Manager, Domestic Headquarters, Board
    Oversea General Manager, Oversea Headquarters, Board
    Domestic Headquarters, CEO, Board
    Oversea Headquarters, CEO, Board

];


// declared the hierarchy as below

TREE_VIEW:

LOAD Distinct ROLE as VALUE, ROLE & '-ROLE' as NODE_ID, REPORTINGMANAGER & '-REPORTINGMANAGER' as PARENT_NODE_ID resident ORGANIZATION;
LOAD Distinct REPORTINGMANAGER as VALUE,REPORTINGMANAGER & '-REPORTINGMANAGER' as NODE_ID, LEVELOFBUSINESSHEAD & '-LEVELOFBUSINESSHEAD' as PARENT_NODE_ID resident ORGANIZATION;
LOAD Distinct LEVELOFBUSINESSHEAD as VALUE,LEVELOFBUSINESSHEAD & '-LEVELOFBUSINESSHEAD' as NODE_ID,  LEVELOFBUSINESSHEAD & '-LEVELOFBUSINESSHEAD' as PARENT_NODE_ID resident ORGANIZATION;


HIERARCHY_TABLE:
Hierarchy(NODE_ID_H,PARENT_NODE_ID_H, ID, PARENT_NAME, NAME, Organization_Structure) load
NODE_ID,
NODE_ID as NODE_ID_H,
PARENT_NODE_ID as PARENT_NODE_ID_H,
VALUE as ID,
VALUE as NAME
resident TREE_VIEW;


//created a list box, in the properties,select the show as tree view check box,the image shows below:


Saturday, 28 January 2017

Master Calendar


In QlikView, many times we need to create a calendar reference object which can be linked to any data set present in QlikView's memory. 

LET vDateMin = Num(MakeDate(2016,1,1));  
LET vDateMax = Num(MakeDate(2016,12,31));        


TempCalendar:
LOAD
  $(vDateMin) + RowNo() - 1 AS DateNumber,
  Date($(vDateMin) + RowNo() - 1) AS TempDate
AUTOGENERATE 1
WHILE $(vDateMin)+IterNo()-1<= $(vDateMax);

Calendar:
LOAD
    Date(TempDate) AS STANDARTDATE,
  AutoNumber(Year(TempDate)&Month(TempDate)&Day(TempDate)) as TIMEKEY,
    // Standard Date Objects
    Day(TempDate) AS STANDARTMONTHDATE,
    WeekDay(TempDate) AS WEEKDAY,
    Week(TempDate) AS WEEK,
    Month(TempDate) AS MONTH,
    'Q' & Ceil(Month(TempDate)/3) AS QUARTER,
    Year(TempDate) AS YEAR
RESIDENT TempCalendar ORDER BY TempDate ASC;
DROP TABLE TempCalendar;

LET vDateMin = Null();
LET vDateMax = Null();


From this time dimension table,you can see a Master Calendar which will supply the additional date fields like Quarter, Day etc as required by any data set of 2016.

Sunday, 22 January 2017

Changing The Grain Of Budget Table

//Load Bueget,Percentage And Check the Granulariy 

Budget:

LOAD Budget_ID,
     Employee_ID,
     Deparment,
     Product_ID,
     Name,
     Year,
     Budget_Amount As Q_Budget_Amount
FROM
[C:\Users\Peidu\Desktop\Project\2017-01-21\source_project\Granularity\Budget.txt]
(txt, codepage is 936, embedded labels, delimiter is ',', msq);

Percentage:
Mapping
LOAD Quarter,
     Percentage
FROM
[C:\Users\Peidu\Desktop\Project\2017-01-21\source_project\Granularity\Percent.txt]
(txt, codepage is 936, embedded labels, delimiter is ',', msq);


You can see Budget_Amount is calculated by Year, now we want to make it in Quarter following the ratio in Percentage table. 

//Create Calendar

Calendar:

LOAD Year,
     Quarter
FROM
[C:\Users\Peidu\Desktop\Project\2017-01-21\source_project\Granularity\Calendar.txt]
(txt, codepage is 936, embedded labels, delimiter is ',', msq);

// Left Join Fact Table With Calendar

Left Join(Budget)

Load Year,Quarter Resident Calendar;

//Mapping Percentage And Left Join Budget Table

Left Join(Budget)

Load Budget_ID,
     Employee_ID,
     Deparment,
     Product_ID,
     Name,
     Year,
     Quarter,
     Q_Budget_Amount * ApplyMap('Percentage',Quarter) As Budget_Amount Resident Budget;
   
     Drop Field Q_Budget_Amount;


//Budget_Amount Are Distributed Into Quarter Following Percentage Rate

Saturday, 14 January 2017

Hash Function With Slowly Change Dimension

hash function is an algorithm that maps data of arbitrary length to data of a fixed length. Using Hash Function we can make Slowly Change Dimension to clarify the past and current situations of Employee


Let's make an example to explain:

Step 1:  Assume there was a Original Employee Table stored in QVD file:

--- Create an Employee Table in Qlikview for Original as below:


//Employee:
//LOAD 
//     Hash256(EmployeeID,Name,City) As HashKey,
//     EmployeeID, 
//     Name, 
//     City, 
//     From
//FROM
//[C:\Users\Peidu\Desktop\Project\2017-01-14\Original.txt]
//(txt, codepage is 936, embedded labels, delimiter is ',', msq);
//
//Store Employee Into Employee.QVD;

Original Table shows:


From Picture we can see Tom worked in Newyork from 2016/01/01,Now Tom shifted to Chicago From 2017/01/01,how to describe the status of Tom.

Step 2: Create a Temperate Table to begin slowly change dimension process, use Concatenate to make connection between Original and Present Tables, the Purpose of  Step 2 is to design From column:
Temp:

Load HashKey,EmployeeID,Name,City,From From Employee.QVD(qvd);

Concatenate(Temp)

Load Hash256(EmployeeID,Name,City) As HashKey,EmployeeID,Name,City,From 

From
[C:\Users\Peidu\Desktop\Project\2017-01-14\Present.txt]
(txt, codepage is 936, embedded labels, delimiter is ',', msq) Where Not Exists(HashKey,Hash256(EmployeeID,Name,City));

Store Temp Into Employee.QVD;

the table shows:


*****************NOTICE***************
WHERE NOT EXISTS Clause plays a  important role in the process, it tells Qlikview Do Not Load records with the same HashKey( the HashKey we made in Employee already) and the same Hash256(EmployeeID,Name,City)-- we made in Temperate Table.

Step 4: Load Employee again and design the column To 

Employee:

Load EmployeeID,
        Name,
        City,
        From,
       Date(If(Previous(EmployeeID)<>EmployeeID,' ',Previous(From)-1),'YYYY-MM-DD') As To 
Resident Temp Order By EmployeeID,From Desc;
     
     Drop Table Temp;


the final result shows the current and the past status of Employee, we can see Tom worked in Newyork from 2016/01/01 to 2016/12/31, and started work in Chicago from 2017/01/01.For Jerry, not changed, she still worked in Miami.

the script above designed from,to columns with different locations,here is a question:
how about Tom go back Newyork? The new record will not be loaded in the table since there is a hashkey fot (001,Tom,Newyork) already. We have to add a flag column to solve this issue.


Monday, 9 January 2017

Two Link Table Design Strategies for multiple fact tables

Background:
In Qlikview, using link table is a typical solution for  the scenario that multiple fact tables share several conformed dimensions.
While in the projects I have experienced, I see two major design strategies regarding the link table:

1. Classic Design :
     1.1 using the same key column across all the fact tables
     1.2 in the link table, store the individual dimension key column;

The advantage of this approach is that the whole diagram is simple, the performance is good, the link table size is small;

The disadvantage of this approach is that we need to have a whole idea about the

2. In several of the projects I experienced, I also saw another design strategy for the link table, I called it QuickAndDirtyWhileEasy approach:
   2.1 For each fact table, we create a unique key for that fact table;
   2.2 Link table is a result of concatenating the individual fact table's unique key and individual dimension table unique key column.
The advantage of this approach is that it is very easy to grasp and implement. The result of the model is quite reliable. It is easy to handle different granularity among different fact tables.
The disadvantage of this approach is that the diagram, the link table is a bit ugly. Because the record in the link table will have more columns is NULL. And the dashboard performance is not as ideal comparing to the option 1. Especially if we have more data in the fact tables.

Conclusion:
I used to be a fan of option 1. While through several projects, I found option 2 is not a bad idea in the situation of small-medium size project, especially when data volume and performance is not a problem, in that case, the modelling and development is much faster and easier.


Saturday, 7 January 2017

Case Study: Multiple facts together with slowly changing dimension


Background: 

In data warehouse, it is a typical topic regarding how to handle multiple fact tables who share several conformed dimensions. 

In Qlikview, the most common solutions including concatenating multiple fact tables into one fact table if they are quite similar. 

Another solution is to create a link table to join the fact tables and the conformed dimensions.

In this case study, we will see the modelling changes to link the two fact tables Sales and Plan together with three conformed dimensions Department,Employee and Product.

Please note that the employee dimension has the support for slowly changing dimension.

Let see the example below:

After loading all the tables into Qlikview, the diagram in Table Viewer shows :


There are SSyn Keys between the tables


Data Modelling:

//1.LOAD FACT TABLES 

Plan:

LOAD EmployeeID&Name&DepartmentID&Department&CountryID&Country&ProductID&Product&Year As ID, 
     PlanID, 
     EmployeeID, 
     Name, 
     DepartmentID, 
     Department, 
     CountryID, 
     Country, 
     ProductID, 
     Product, 
     Year, 
     Amount AS Plan_Amount
FROM
[C:\Users\Peidu\Desktop\Project\2017_01_07\Plan.txt]
(txt, codepage is 936, embedded labels, delimiter is ',', msq);

Sales:

LOAD EmployeeID&Name&DepartmentID&Department&CountryID&Country&ProductID&Product&Year As ID,
     SalesID, 
     EmployeeID, 
     Name, 
     DepartmentID, 
     Department, 
     CountryID, 
     Country, 
     ProductID, 
     Product, 
     Year, 
     Amount AS Sales_Amount
FROM
[C:\Users\Peidu\Desktop\Project\2017_01_07\Sales.txt]
(txt, codepage is 936, embedded labels, delimiter is ',', msq);

//2.CREATE LINKTABLE

LinkTable:

LOAD ID,EmployeeID,Name,DepartmentID,Department,CountryID,Country,ProductID,Product,Year RESIDENT Plan;

CONCATENATE(LinkTable)

LOAD ID,EmployeeID,Name,DepartmentID,Department,CountryID,Country,ProductID,Product,Year RESIDENT Sales;

DROP FIELDS EmployeeID,Name,DepartmentID,Department,CountryID,Country,ProductID,Product,Year FROM Plan,Sales;

//3.LOAD DIMENSION TABLE EMPLOYEE 

Employee:

LOAD EmployeeID&From&To AS KEY,
     EmployeeID, 
     //Name, 
     From, 
     To,
     City
FROM
[C:\Users\Peidu\Desktop\Project\2017_01_07\Employee.txt]
(txt, codepage is 936, embedded labels, delimiter is ',', msq);

After loading Employee, we see the diagram below:


The results is also wrong:


We need to make slowly change dimension first, then remove synthetic key:

//4.SLOWLY CHANGE DIMENSION WITH LINKTABLE 

Bridge:

INTERVALMATCH (Year,EmployeeID)

LOAD From,To,EmployeeID RESIDENT Employee;

LEFT JOIN(LinkTable)

LOAD Year,From,To,EmployeeID,EmployeeID&From&To AS KEY RESIDENT Bridge;

DROP TABLE Bridge;

//5.GENERATE COMPOSITE KEY BETWEEN EMPLOYEE AND LINKTABLE SINCE THERE IS Synthetic Key IN TABLE VIEWER

DROP FIELDS EmployeeID,From,To FROM LinkTable;

The diagram shows below:


The result shows below, notice Year column matches From & To columns now:


Loading other dimension tables and disselect repeated columns in LinkTable:
//6.LOAD DIMENSION TABLES
Product:

LOAD ProductID, 
     //Product, 
     Producer
FROM
[C:\Users\Peidu\Desktop\Project\2017_01_07\Product.txt]
(txt, codepage is 936, embedded labels, delimiter is ',', msq);


Department:
LOAD DepartmentID, 
     //Department, 
     Discription
FROM
[C:\Users\Peidu\Desktop\Project\2017_01_07\Department.txt]
(txt, codepage is 936, embedded labels, delimiter is ',', msq);

Country:

LOAD CountryID, 
     //Country, 
     Region
//     City
FROM
[C:\Users\Peidu\Desktop\Project\2017_01_07\Country.txt]
(txt, codepage is 936, embedded labels, delimiter is ',', msq);


The Final Diagram is:


You can see the data modelling is Star Schema.

And we also get report with correct data: